Analytic Landscapes
A brief history
A traditional concept for visualizing complex functions is the so called analytic landscape. Probably introduced by Edmond Maillet in 1903, it depicts the graph of the absolute value of a function.
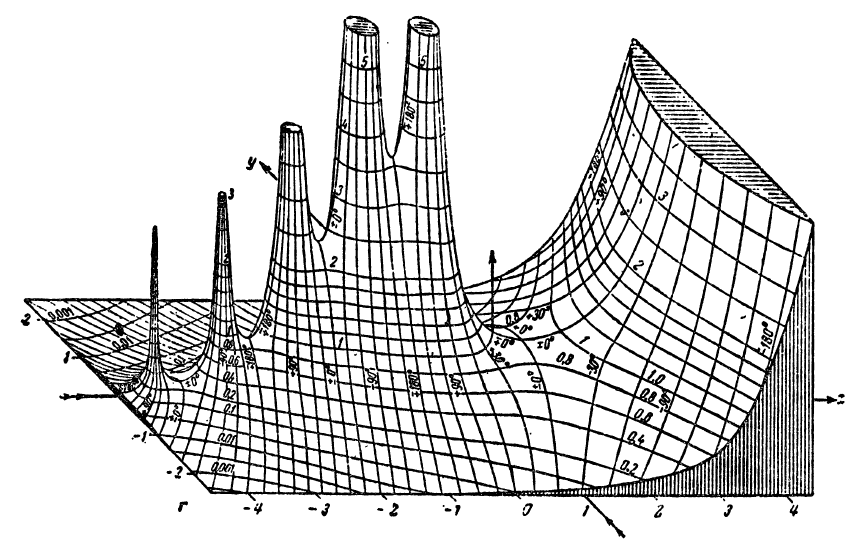
In the first half of the preceding century analytic landscapes became rather popular. The Figure 1 reproduces a historical illustration from the book Funktionentafeln mit Formeln und Kurven by Jahnke and Emde of 1909. It shows the analytic landscape of the complex Gamma function and reached an almost iconic status. Today it is hard to believe that this detailed hand-drawn picture could be created without the help of computers!

In the era of black-and-white illustrations this shortcoming was often compensated by endowing the analytic landscape with lines of constant argument as in the previous figure, where the argument is explicitly indicated by its numerical value. Modern computer technology allows us to achieve the same effect much better using colors, which yields the colored analytic landscape shown in Figure 2.
Dynamic exploration
Complex functions $ f:\mathbb{C}\to\mathbb{C} $ can be visualized by plotting the function $g: \mathbb{R^2} \to \mathbb{R}$ with $$g(x,y) = |f\left(x + i y\right)|.$$ The color of each point $\left(x, \,y, \,g(x,y)\right)$ indicates the phase (or argument) of the complex number $f(x + i y).$
In the applet below you can explore colored analytic landscapes. Use the blue slider on the right side for zooming out/in. The black slider defines a real scalar a $ \in [ -0.14, 1.14].$
In practice, it is often difficult to generate analytic landscapes which allow us to read off properties of the complex function easily and precisely. An alternative approach is not only simpler but even more general: Instead of drawing a graph in $\mathbb R^3,$ we can depict a function directly on its domain by color coding its values completely. This method is called domain coloring.
Note: The last applet was written by Aaron Montag using CindyJS. The source code can be found at GitHub.